
Where the logs tell you what happened, Insights tells you what it means. It answers four questions: how much effort has Qrtr saved, what is currently stuck and with whom, how your reviewers and approvers actually behave, and which quality profiles are doing the work.
It is the most opinionated page in Qrtr. It doesn't just present numbers — it names the people holding things up and characterises their behaviour patterns. That makes it genuinely useful, and it also means it deserves a little care in how it's used. There's a note on that at the end.
Opening Insights and choosing a windowSelect Insights in the left navigation. The panel down the left has two parts: On this page, which jumps you to each of the four sections, and Window, which sets the reporting period.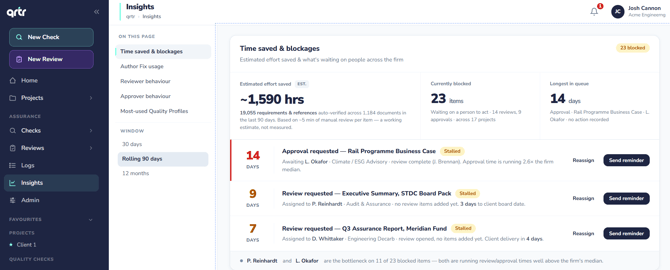
The window options are 30 days, Rolling 90 days (the default) and 12 months. Changing the window recalculates every panel, and each panel's subtitle updates to match — so a panel reading "last 90 days" will change to "last 30 days".
The first panel is subtitled "Estimated effort saved & what's waiting on people across the firm", with a count badge in the top right such as 10 blocked. Three figures sit across the top.
Estimated effort saved carries an EST. tag and shows a figure such as ~636 hrs. Underneath, Qrtr shows its working — for example that several thousand requirements were auto-verified across a number of documents in the period, based on roughly five minutes of manual review per item. The panel is explicit that this is a working estimate, not measured.
Take that caveat seriously and repeat it if you quote the number. It is a modelled figure derived from a per-item assumption, not a measurement of anyone's time. It's a reasonable way to express scale, and it is not an auditable saving.
Currently blocked shows a count of items with a breakdown beneath, such as items waiting on a person to act, split into reviews and approvals, across a number of projects. "Blocked" here means specifically waiting on a human — not still processing.
Longest in queue shows the worst case in days, naming the stage, the document and the person it's sitting with.
The blockage list
Beneath the summary is the list of everything currently stuck, worst first. Each row shows:
- A large days count on the left, colour-coded, showing how long the item has been waiting.
- A title stating the stage and the document — either Approval requested — [document] or Review requested — [document].
- A Stalled badge where an item has passed the point of being merely slow.
- A line naming the person and project — Awaiting [name] for approvals or Assigned to [name] for reviews, followed by the project name.
- Two action buttons, Reassign and Send reminder.
- Using Quality Logs
- Understanding your quality profile
- An introduction to the review workflow
- How to set up and edit a project
At the foot of the list Qrtr adds a written observation, for example that two named people are the bottleneck on 8 of 10 blocked items. This is the single most actionable line on the page, because it distinguishes a systemic capacity problem from a scatter of unrelated delays.
Reassign and Send reminder
Send reminder notifies the person the item is waiting on. Reassign moves the item to someone else.
Both act on live work and affect other people, so treat them accordingly. A reminder is the lighter touch and the right first move when someone is simply behind. Reassignment is the right move when the summary line tells you one person is the bottleneck on most of the queue, or when someone is away — but it changes who is accountable for a piece of assurance work, so it's worth a conversation rather than a click.

Subtitled "vs each other & the firm baseline", this table compares your reviewers. The columns are Reviewer, Reviews, Median time, Issues / review, Resolved / does not apply, and Pattern.
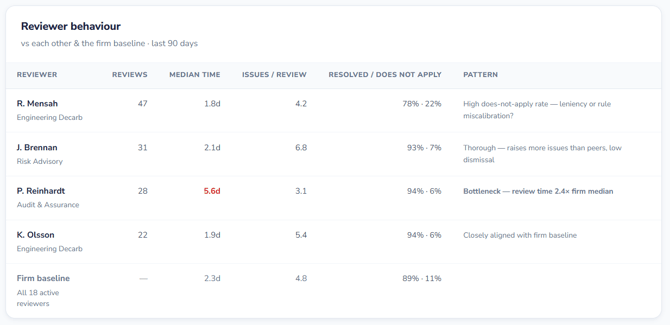
The interesting column is Resolved / does not apply. It shows the split between issues a reviewer resolved and issues they dismissed as not applicable. Two reviewers can process the same volume at the same speed while doing quite different things — one working through issues, the other setting them aside. Pattern is Qrtr's plain-language characterisation of what a reviewer's numbers suggest.
If there are no completed reviewer sign-offs in the selected window, the table shows "No completed reviewer sign-offs in this window." Widening the window to 12 months is the first thing to try.
Approver behaviourSubtitled "Final workflow stage · sign off or return to reviewer", this is the equivalent table for approvers. Columns are Approver, Approvals, Median time, Sign-off / return, Avg score at sign-off, and Pattern.
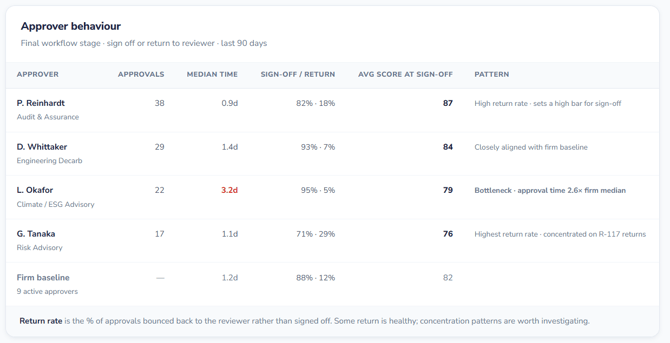
Sign-off / return is the key measure, given as two percentages. The footnote defines return rate as the proportion of approvals bounced back to the reviewer rather than signed off, and adds that some return is healthy while concentration patterns are worth investigating. That's the right framing: a zero return rate may mean approval has become a formality, and a very high one may mean work is arriving underdone — or that one approver applies a markedly different standard from everyone else.
Avg score at sign-off shows the typical Qrtr Check score of documents at the point they were approved. Read alongside your pass threshold, it tells you whether approvals are happening comfortably above the bar or right at it.
A Firm baseline row shows the organisation-wide figures, annotated with how many active approvers it covers, so you can see whether an individual is an outlier or simply typical.
The final panel is subtitled along the lines of "Top 6 of 7 active profiles · by qrtr runs". Columns are Quality profile, Projects, Qrtr runs, Avg score, Trend and Status.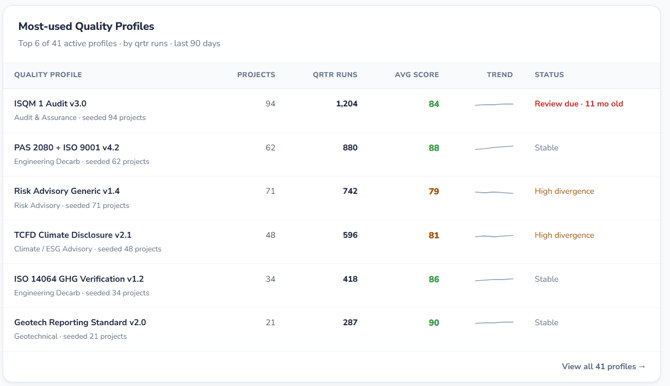
This tells you which of your profiles are actually being used. A profile with many projects and many runs is load-bearing, and changes to it need care. A profile with zero runs across several months is either redundant or a sign that people aren't finding it. Some profiles carry a Seeded tag showing they were pre-populated rather than built by your team.
Trend and Status summarise movement in average score — Stable meaning no meaningful change. A profile whose average score is drifting downward usually means either the standard has tightened or the incoming work has weakened, and it's worth knowing which.
View all 7 profiles → at the foot takes you to the full quality profiles list.
A sensible weekly rhythm is to open Insights on Rolling 90 days, read the observation line at the foot of the blockage list first, and act on that rather than on individual rows. If one or two people are the bottleneck on most of the queue, the answer is a capacity or coverage conversation, not ten reminders.
For monthly or quarterly reporting, switch to 12 months so the behaviour tables have enough completed work to be meaningful. Small samples produce dramatic-looking percentages — a single return out of one approval reads as a 100% return rate.